In today's digital landscape, data analytics is key to understanding user behavior, optimizing performance, and making data-driven decisions. For businesses with a digital presence, platforms like Yandex Metrica provide crucial insights into website and app usage. However, aggregating and analyzing this data in real time can be a challenge without the right tools. In this blog, we'll explore how Tapdata, a powerful real-time data synchronization tool, can help you seamlessly integrate Yandex Metrica data into MongoDB for efficient storage and analysis.
What is Yandex Metrica?
Yandex Metrica is a robust web analytics platform developed by Yandex, a Russian multinational corporation. Similar to Google Analytics, Yandex Metrica provides a comprehensive set of tools for tracking user behavior, understanding traffic sources, measuring site engagement, and analyzing conversion rates. Some of its key features include:
-
Real-time user data: Track page views, sessions, bounce rates, and more in real-time.
-
Heatmaps and session replay: Understand user interaction with your site through visual heatmaps and session replays.
-
Advanced segmentation: Filter and segment data by user demographics, acquisition channels, or behaviors.
-
Customizable reports: Create custom reports to focus on metrics that matter to your business.
Yandex Metrica’s ability to capture detailed metrics about user behavior makes it a valuable tool for marketers, analysts, and developers alike. However, extracting and syncing this data for further analysis or storage can be a complex and time-consuming process if you're working with large volumes of data across multiple platforms.
What is Tapdata?
Tapdata is a versatile, real-time data synchronization and integration platform that facilitates seamless data replication between disparate systems. Whether you're dealing with databases, applications, or APIs, Tapdata provides an easy-to-use solution for connecting, transforming, and replicating data in real time.
Some key features of Tapdata include:
-
Real-time data synchronization: Tapdata allows you to sync data in real time, making sure your systems are always up-to-date.
-
Custom connectors: Tapdata supports custom connectors, allowing you to integrate with virtually any system, including third-party APIs like Yandex Metrica.
-
Transformation capabilities: Tapdata offers built-in transformation functions to reshape data into the format you need for your target systems.
-
High scalability: Tapdata is designed to handle large volumes of data, making it ideal for growing businesses and big data scenarios.
-
Ease of use: Tapdata's intuitive interface simplifies the process of data integration, even for non-technical users.
By combining Yandex Metrica’s powerful analytics with Tapdata’s seamless integration capabilities, you can create a unified data pipeline that syncs your website analytics data into MongoDB for further analysis and visualization.
Steps to Sync Yandex Metrica Data to MongoDB Using Tapdata
How to Create a Counter in Yandex Metrica
Here’s a step-by-step guide to creating a counter in Yandex Metrica:
Step 1: Sign Up or Log In to Yandex Metrica
-
Create a Yandex Account: If you don’t already have a Yandex account, you’ll need to create one. Go to Yandex’s sign-up page and follow the instructions to create your account.
-
Access Yandex Metrica: Once you have an account, visit the Yandex Metrica homepage at https://metrika.yandex.com and log in with your Yandex credentials.
Step 2: Add a New Counter
-
After logging into Yandex Metrica, click on the "Add counter" button located on the main dashboard or in the "Counters" section.
-
You will be prompted to enter basic details for your new counter, including:
-
Website Name: Enter a name for your site or app. This name will help you identify your counter in the future.
-
Website URL: Enter the URL of the website you want to track (e.g.,
https://www.yoursite.com). -
Time Zone: Select the time zone of your website or app. This will help you correctly interpret time-based metrics in your reports.
-
-
Advanced Settings (optional):
-
You can enable or disable specific features like:
-
Tracking of campaign sources: If you're running marketing campaigns, you can enable tracking of traffic sources (e.g., UTM parameters).
-
Track session and user data: You can customize what information you want to track, such as user location, device type, etc.
-
-
-
Click "Create": After entering the required information, click the "Create" button to create your counter.
Step 3: Install the Yandex Metrica Tracking Code
After the counter is created, Yandex Metrica will provide you with a tracking code that needs to be added to your website. This code collects data and sends it to Yandex Metrica. Here's how to install it:
-
Copy the Tracking Code: After creating the counter, you'll see a page with the counter settings and a block of JavaScript code under the “Counter code” section.
-
Add the Code to Your Website: Copy the provided JavaScript snippet and insert it into the
<head>section of every page on your website that you want to track. You can do this manually, or use a tag management system like Google Tag Manager to insert the code. -
Example of the Yandex Metrica tracking code:
<script type="text/javascript" >
  (function(m,e,t,r,i,k,a){
    m[i]=m[i]||function(){(m[i].a=m[i].a||[]).push(arguments)};
    m[i].l=1*new Date();
    k=e.createElement(t);
    a=e.getElementsByTagName(t)[0];
    k.async=1;k.src=r;
    a.parentNode.insertBefore(k,a)
  })(window,document,"script","https://mc.yandex.ru/metrika/watch.js","ym");

  ym(12345678, "init", {
    clickmap:true,
    trackLinks:true,
    accurateTrackBounce:true
  });
</script>
<noscript><div><img src="https://mc.yandex.ru/watch/12345678" style="position:absolute; left:-9999px;" alt="" /></div></noscript>-
Replace
12345678with your actual counter ID. -
Verify Installation: After adding the code to your website, go back to Yandex Metrica and click on the "Check installation" button to verify if the tracking code is installed correctly. Yandex Metrica will notify you if the installation was successful.
Step 4: Start Tracking Data
Once the counter is installed and configured, Yandex Metrica will begin collecting data from your site or app. The data will include pageviews, user sessions, traffic sources, geographic location, and much more. You can view this data directly in the Yandex Metrica interface or use the API to pull it into other systems, like MongoDB.
Step 5: Set Up a Custom Connection in Tapdata to Fetch Data from Yandex Metrica
-
Navigate to the Connections Menu: In Tapdata, go to the Connections section from the main dashboard.
-
Click on the "Create" Button: To set up a new custom connection, click on the "Create" button.
-
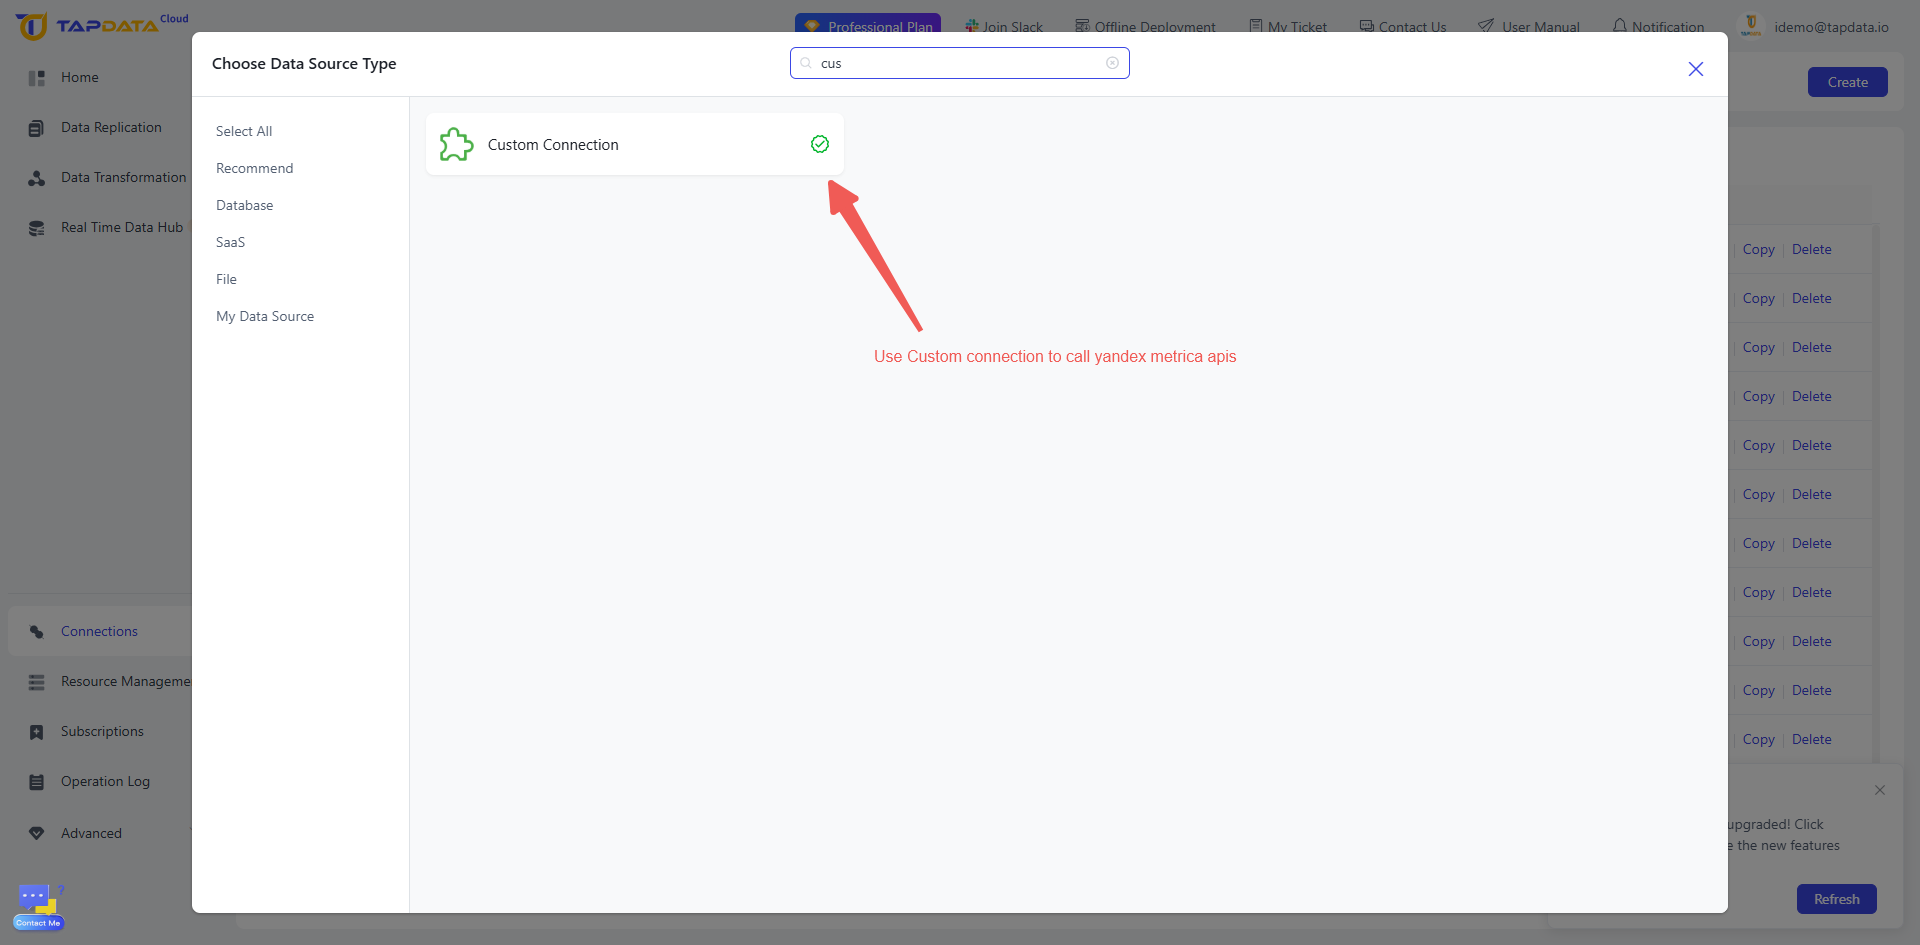
Choose "Custom Connection": Select the option for a Custom Connection to configure a connection to Yandex Metrica.
-
Provide Yandex Metrica Connection Details: Fill in the required details for your Yandex Metrica connection, write a simpleJS script to call yandex api's to fetch data
-
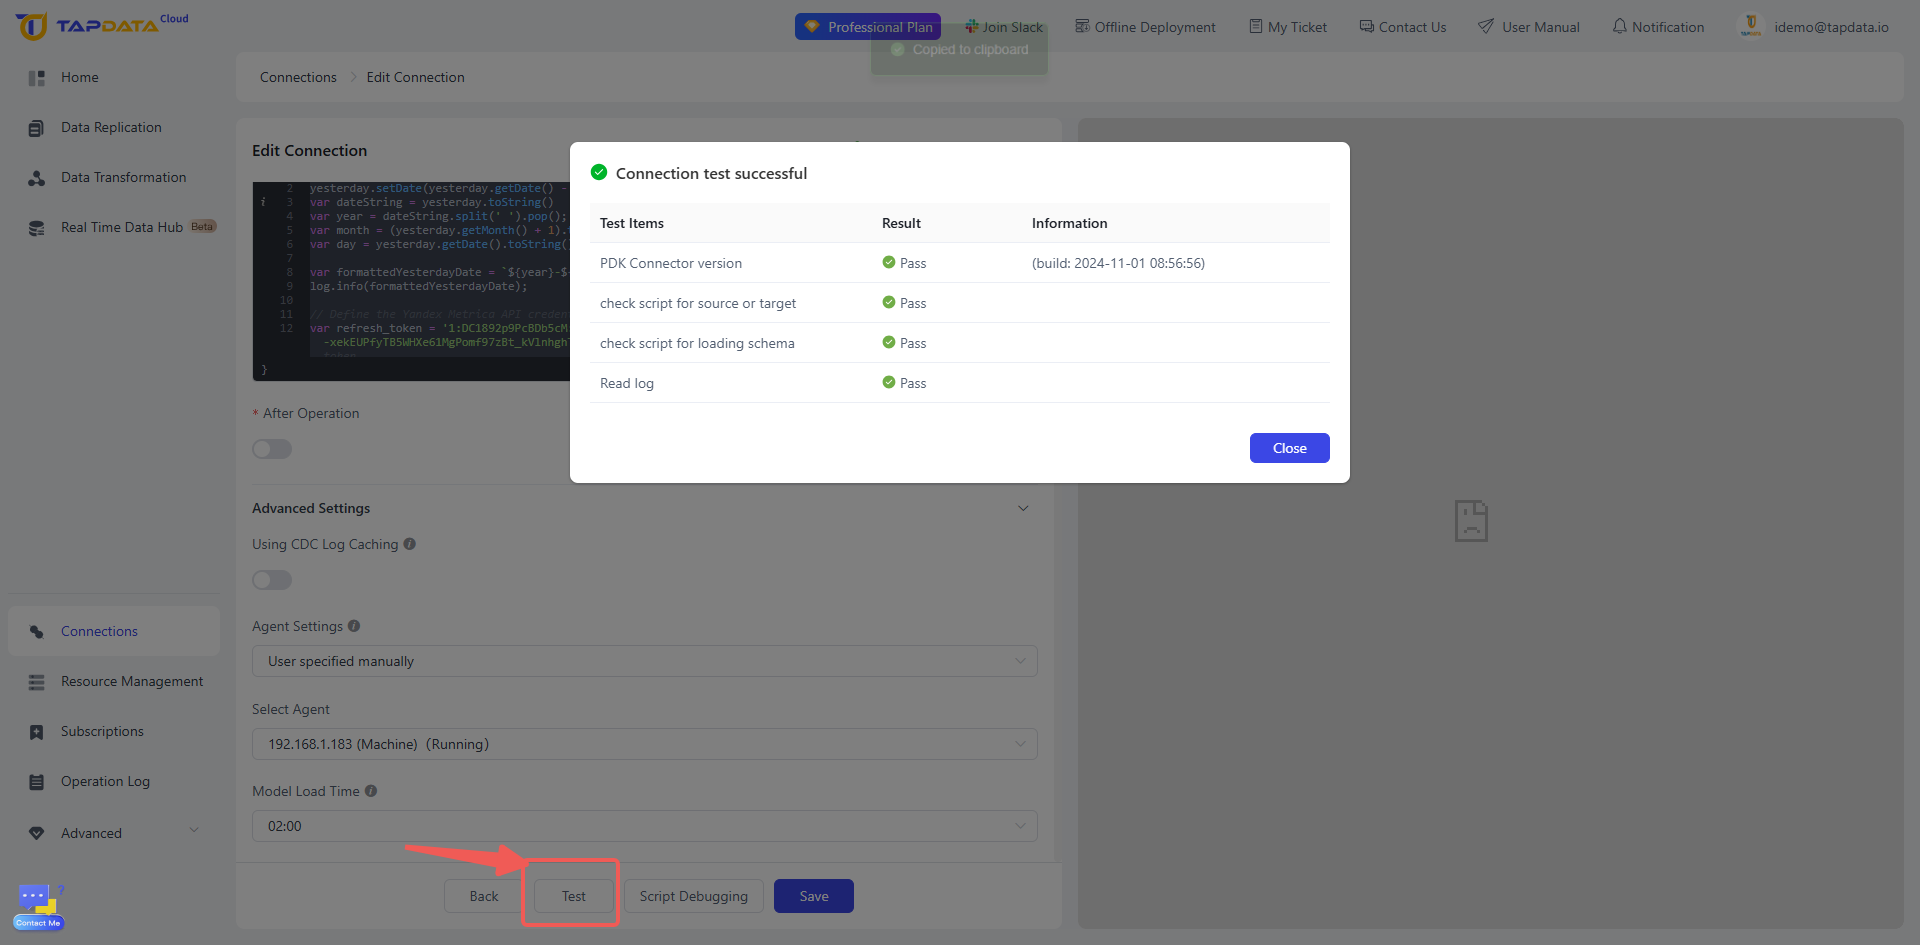
Test the Connection: Once the connection details are configured, you can test the connection to ensure that Tapdata can successfully fetch data from Yandex Metrica.
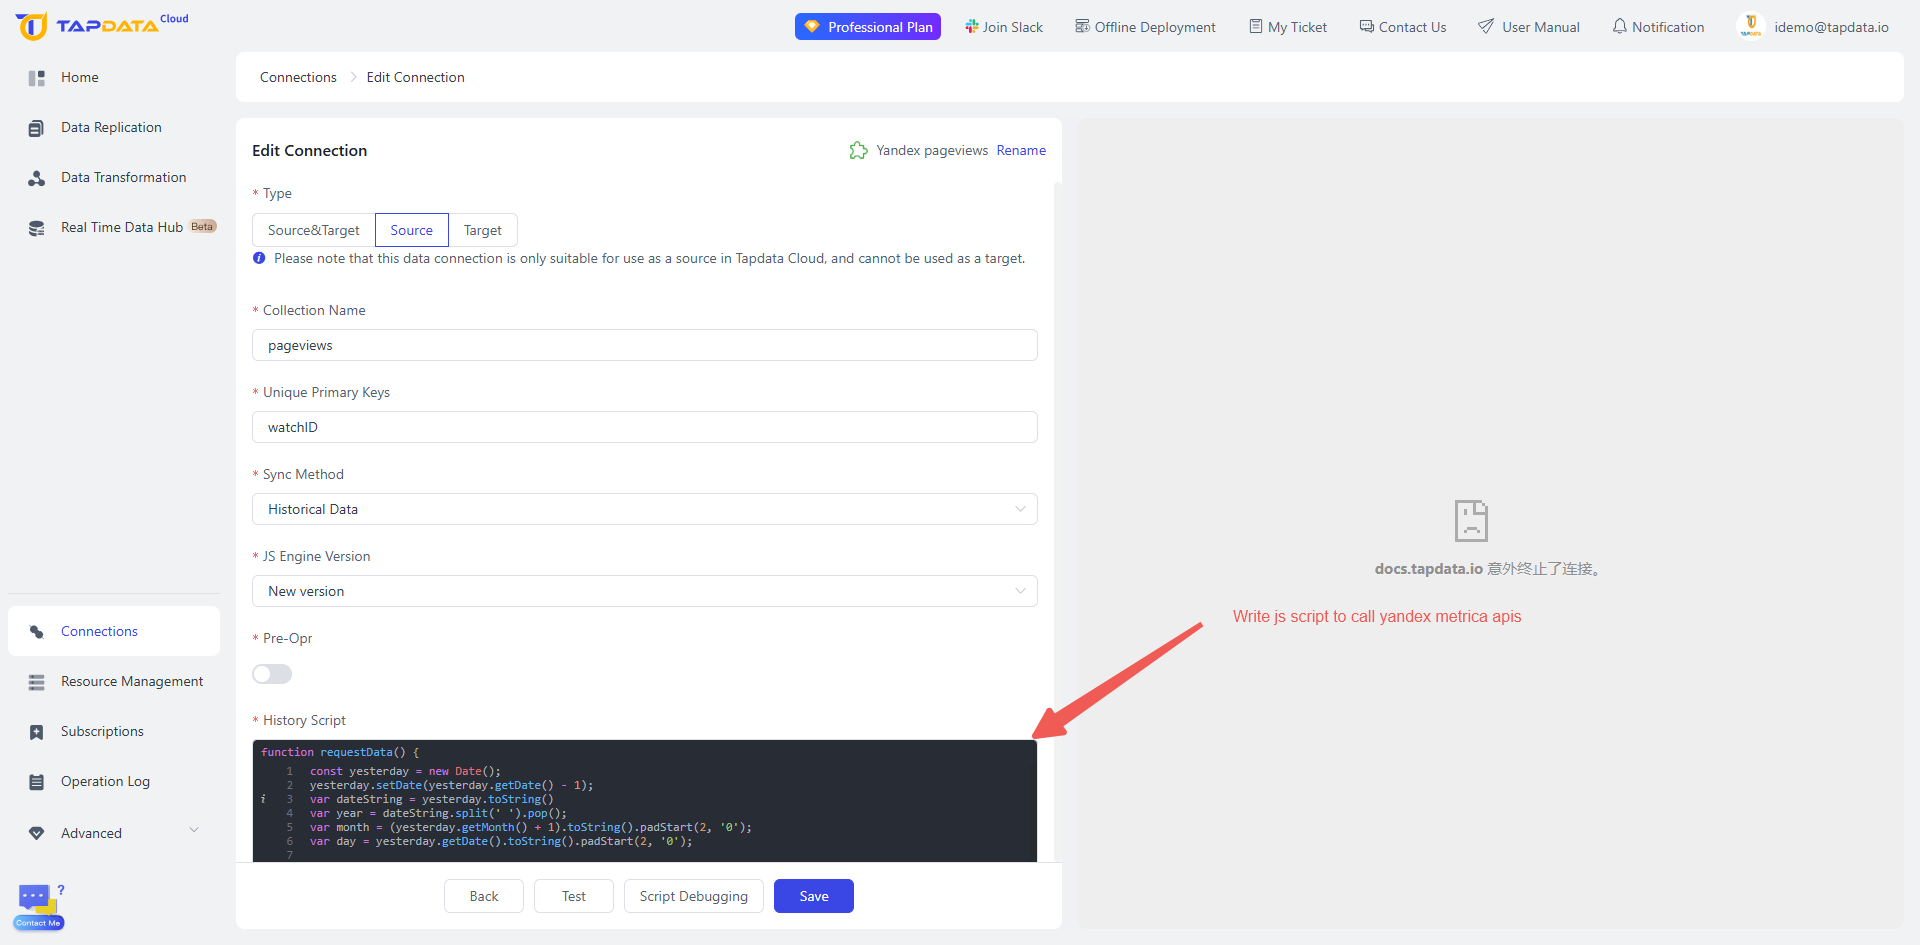
Sample JS script to get pageview logs summary
const yesterday = new Date();
yesterday.setDate(yesterday.getDate() - 1);
var dateString = yesterday.toString()
var year = dateString.split(' ').pop();
var month = (yesterday.getMonth() + 1).toString().padStart(2, '0');
var day = yesterday.getDate().toString().padStart(2, '0');

var formattedYesterdayDate = `${year}-${month}-${day}`;
log.info(formattedYesterdayDate);

// Define the Yandex Metrica API credentials
var refresh_token = '1:DC1892xxxxxxxxxxxxxxxxxxxxxxxxCmKM6mKL1VZtxxxxxx-xekEUPfyTB5WHXe61MgPomf97zBt_kVlnhghTbw:yYcaLvdWFvvBtk8h9tqwhA'; // Replace with your Yandex refresh token
var access_token = 'y0_AgAAAABxxxxxxxxxxxxxxxxxxxxxxxxxxHkaxoZLaqft5jL9UU3pOH4ToA'; // Replace with your Yandex access token
var oauth_url = 'https://oauth.yandex.com/token';
var generate_report_url = "https://api-metrika.yandex.net/management/v1/counter/9xxxx472/logrequests?date1=2024-07-29&date2="+formattedYesterdayDate+"&source=hits&fields=ym:pv:watchID,ym:pv:counterID,ym:pv:date,ym:pv:dateTime,ym:pv:title,ym:pv:URL,ym:pv:referer,ym:pv:UTMCampaign,ym:pv:UTMContent,ym:pv:UTMMedium,ym:pv:UTMSource,ym:pv:UTMTerm,ym:pv:browser,ym:pv:browserMajorVersion,ym:pv:browserMinorVersion,ym:pv:browserCountry,ym:pv:browserEngine,ym:pv:browserEngineVersion1,ym:pv:browserEngineVersion2,ym:pv:browserEngineVersion3,ym:pv:browserEngineVersion4,ym:pv:browserLanguage,ym:pv:clientTimeZone,ym:pv:cookieEnabled,ym:pv:deviceCategory,ym:pv:from,ym:pv:hasGCLID,ym:pv:GCLID,ym:pv:ipAddress,ym:pv:javascriptEnabled,ym:pv:mobilePhone,ym:pv:mobilePhoneModel,ym:pv:openstatAd,ym:pv:openstatCampaign,ym:pv:openstatService,ym:pv:openstatSource,ym:pv:operatingSystem,ym:pv:operatingSystemRoot,ym:pv:physicalScreenHeight,ym:pv:physicalScreenWidth,ym:pv:regionCity,ym:pv:regionCountry,ym:pv:regionCityID,ym:pv:regionCountryID,ym:pv:screenColors,ym:pv:screenFormat,ym:pv:screenHeight,ym:pv:screenOrientation,ym:pv:screenWidth,ym:pv:windowClientHeight,ym:pv:windowClientWidth,ym:pv:lastTrafficSource,ym:pv:lastSearchEngine,ym:pv:lastSearchEngineRoot,ym:pv:lastAdvEngine,ym:pv:artificial,ym:pv:pageCharset,ym:pv:isPageView,ym:pv:isTurboPage,ym:pv:isTurboApp,ym:pv:link,ym:pv:download,ym:pv:notBounce,ym:pv:lastSocialNetwork,ym:pv:httpError,ym:pv:clientID,ym:pv:counterUserIDHash,ym:pv:networkType,ym:pv:lastSocialNetworkProfile,ym:pv:goalsID,ym:pv:shareService,ym:pv:shareURL,ym:pv:shareTitle,ym:pv:iFrame,ym:pv:recommendationSystem,ym:pv:messenger,ym:pv:parsedParamsKey1,ym:pv:parsedParamsKey2,ym:pv:parsedParamsKey3,ym:pv:parsedParamsKey4,ym:pv:parsedParamsKey5,ym:pv:parsedParamsKey6,ym:pv:parsedParamsKey7,ym:pv:parsedParamsKey8,ym:pv:parsedParamsKey9,ym:pv:parsedParamsKey10";
var client_id = 'xxxxxxxxxxxxxxxxxxxxxxxxxxxxxxxx'; // Replace with your Yandex client ID
var client_secret = 'xxxxxxxxxxxxxxxxxxxxxxxxx'; // Replace with your Yandex client secret
var base_url = 'https://api-metrika.yandex.net/management/v1/counter'


// Function to build URL with query parameters
function makeUrl(input_url, params) {
    var url = input_url + '?';
    for (var key in params) {
        url = url + key + '=' + encodeURIComponent(params[key]) + '&';
    }
    return url.slice(0, -1); // Remove trailing '&'
}

// Function to refresh the access token
function refreshToken() {
    var params = {
        "refresh_token": refresh_token,
        "client_id": client_id,
        "client_secret": client_secret,
        "grant_type": "refresh_token"
    };

    var url = makeUrl(oauth_url, params);
    var result = rest.post(url, 'object');

    if (result.code === 200) {
        access_token = result.data.access_token;
    } else {
        var msg = '======, refreshToken fail, Result is: ' + JSONUtil.obj2JsonPretty(result);
        throw new Error(msg);
    }
}

function getHeaders() {
    return {
        "Authorization": "OAuth " + access_token,
        // "Content-Type": "application/json;charset=utf-8",
        "Accept-Encoding": "gzip, deflate, br",
    };
}
var headers = getHeaders();
var request_id = "";
    var result = rest.post(generate_report_url, {}, headers, 'object');
    log.info("Report Result"+ result)
    if (result.code === 200) {
         request_id = result.data.log_request.request_id;
        log.info("request_id"+ request_id)
        // return request_id;

    } else {
        var msg = '======, Report not generated, Result is: ' + JSONUtil.obj2JsonPretty(result);
        throw new Error(msg);
    }

// Function to check the status of the report
function checkReportStatus() {
    var status_url = "https://api-metrika.yandex.net/management/v1/counter/97xxxxx72/logrequest/" + request_id;
    var result = rest.get(status_url, getHeaders(), 'object');
    log.info("Status Check Result: " + JSON.stringify(result));
    if (result.code === 200) {
        var report_status = result.data.log_request.status;
        return report_status
    } else {
        var msg = '======, Failed to check status, Result is: ' + JSONUtil.obj2JsonPretty(result);
        throw new Error(msg);
    }
}

function csvToObjectArray(csvString) {
  // 将 CSV 字符串按行拆分
  const lines = csvString.trim().split('\n');

  // 解析第一行,作为对象的键
  const headers = lines[0].split('\t');

  // 遍历剩余的行,解析每一行并生成对象
  const objects = lines.slice(1).map(line => {
    const values = line.split('\t');
    const obj = {};
    headers.forEach((header, index) => {
      obj[(""+header).trim().replace("ym:pv:", "")] = (""+values[index]).trim();
    });
    return obj;
  });

  return objects;
}

  let report_status_after_report_creation;
  do {
      report_status_after_report_creation = checkReportStatus();
      // log.info("report Status in while loop"+ report_status_after_report_creation)

  } while(report_status_after_report_creation!='processed');

    var r = rest.get(base_url+"/9xxxxx2/logrequest/" + request_id +"/part/0/download", headers,'string');
    result = "" + r;
    let index = result.indexOf("data");
    let res = result.substring(index + 5, result.length - index);
    if (res.indexOf("}") != -1) {
      res = res.substring(0, result.lengtn-1);
    }

    var jsonData = csvToObjectArray(res);
     for (let i = 0 ; i < jsonData.length; i++){
       core.push(jsonData[i]);
     }
Step 6: Setup Data Replication Pipeline to replicate data deom yandex to mongodb
-
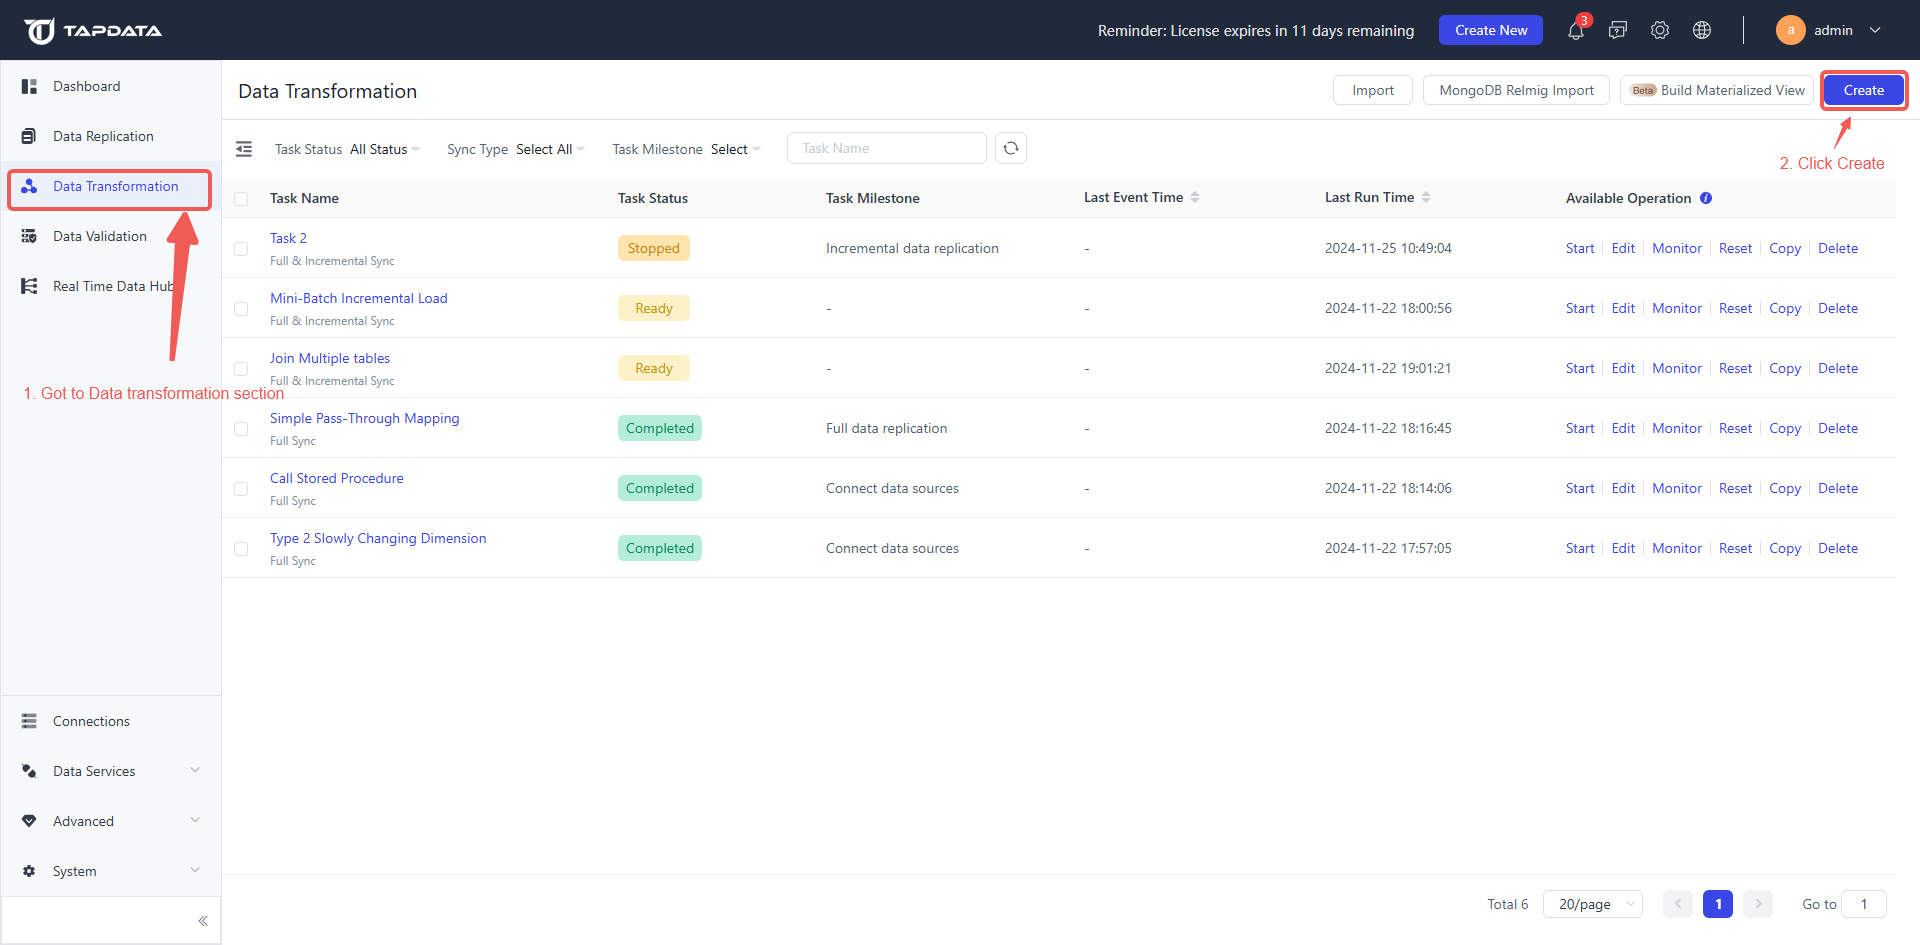
Navigate to the Data Transformation Section: In Tapdata, go to the Data Transformation section from the main dashboard.
-
Click on the "Create" Button: To create a new data transformation, click on the "Create" button.
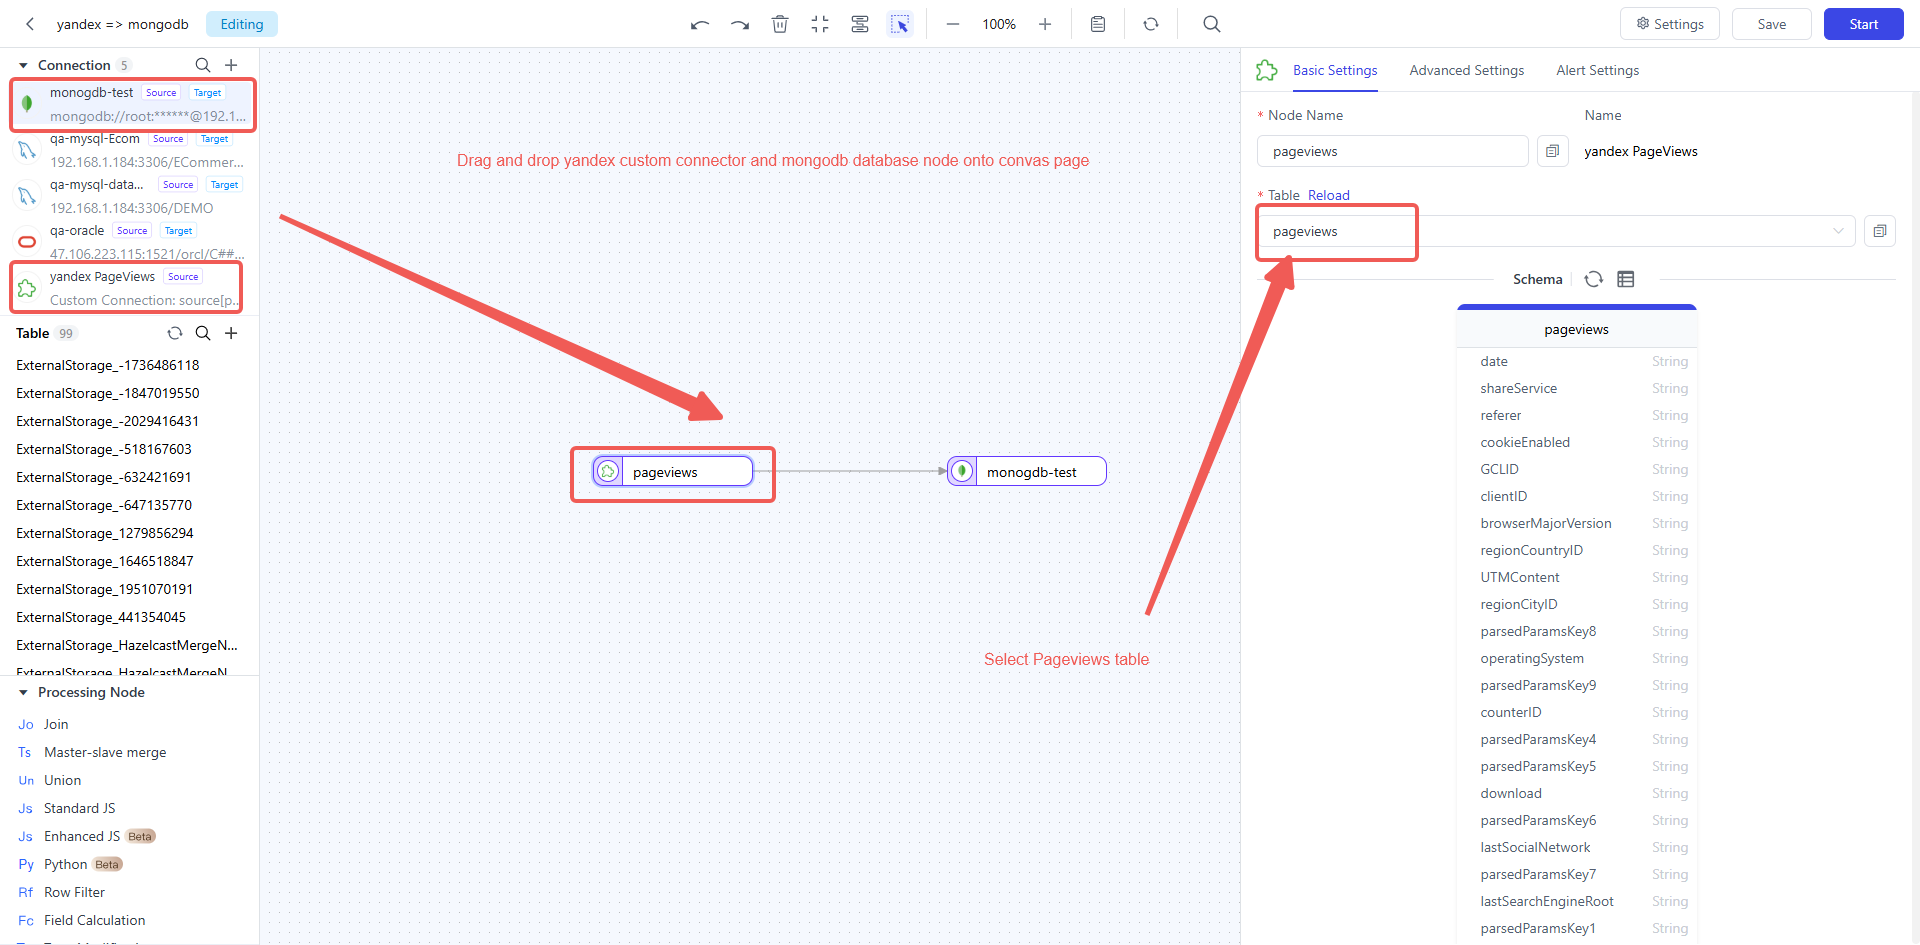
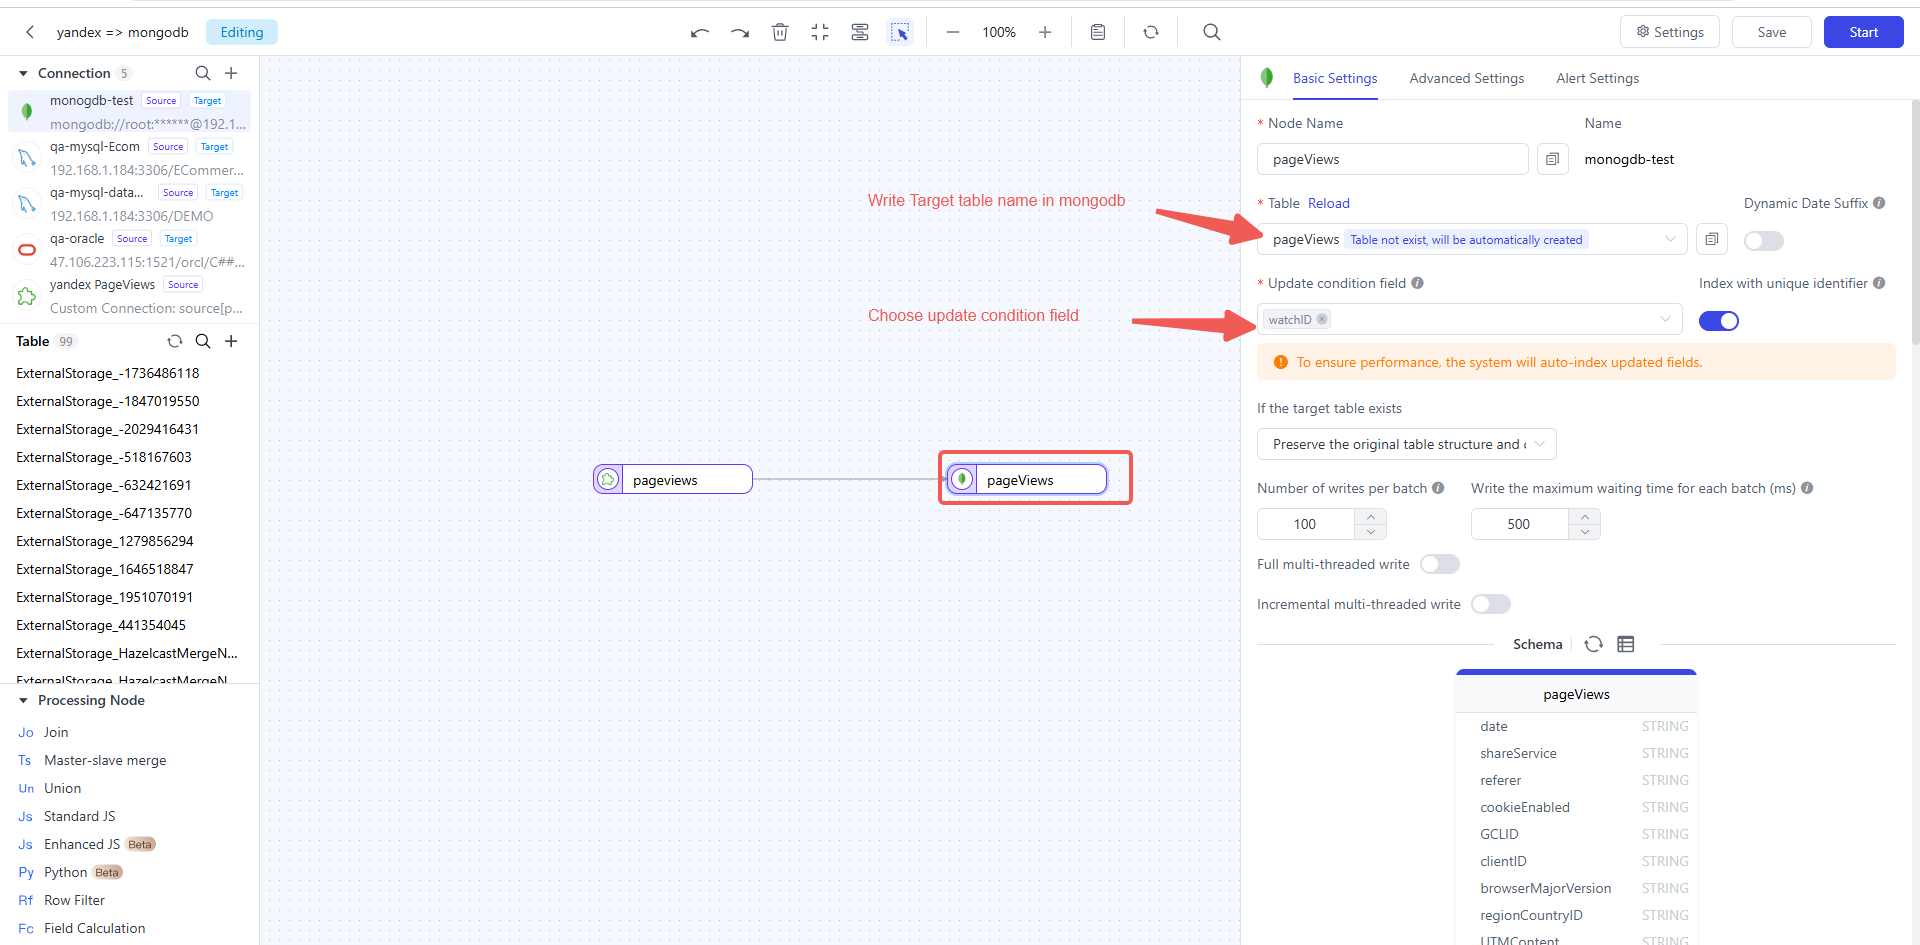

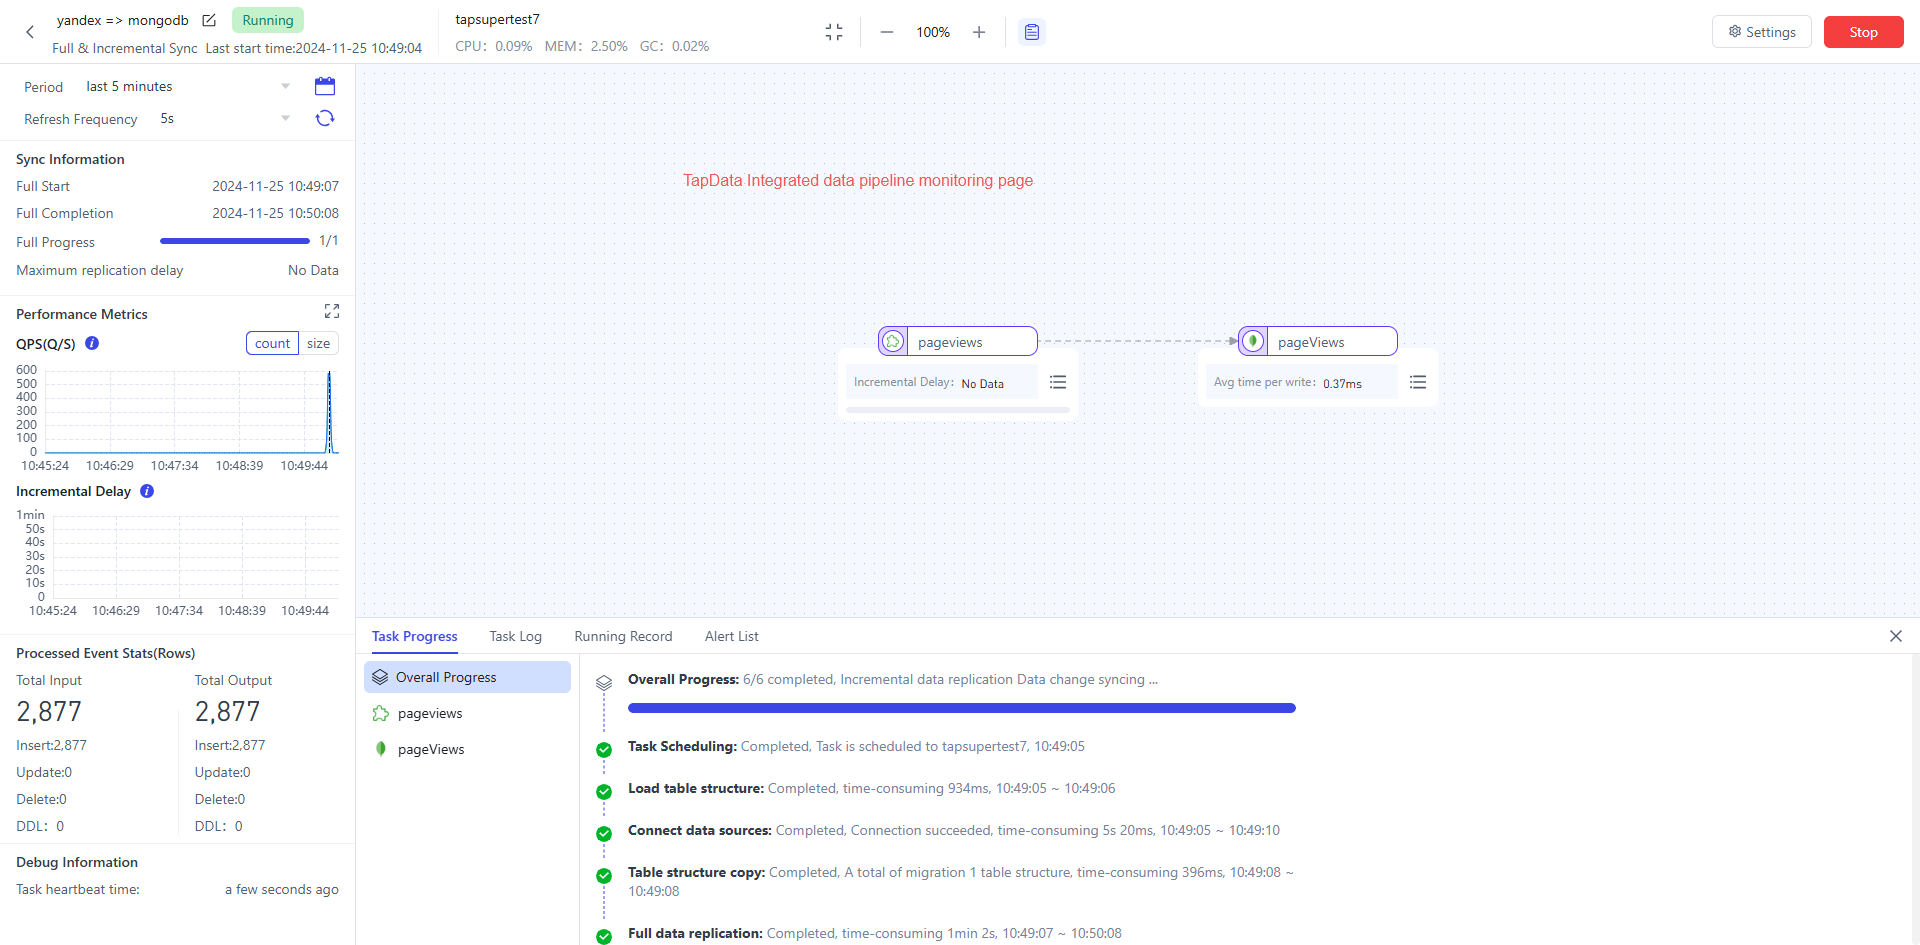
Step 7: See Results in mongodb
Move to mongodb to see results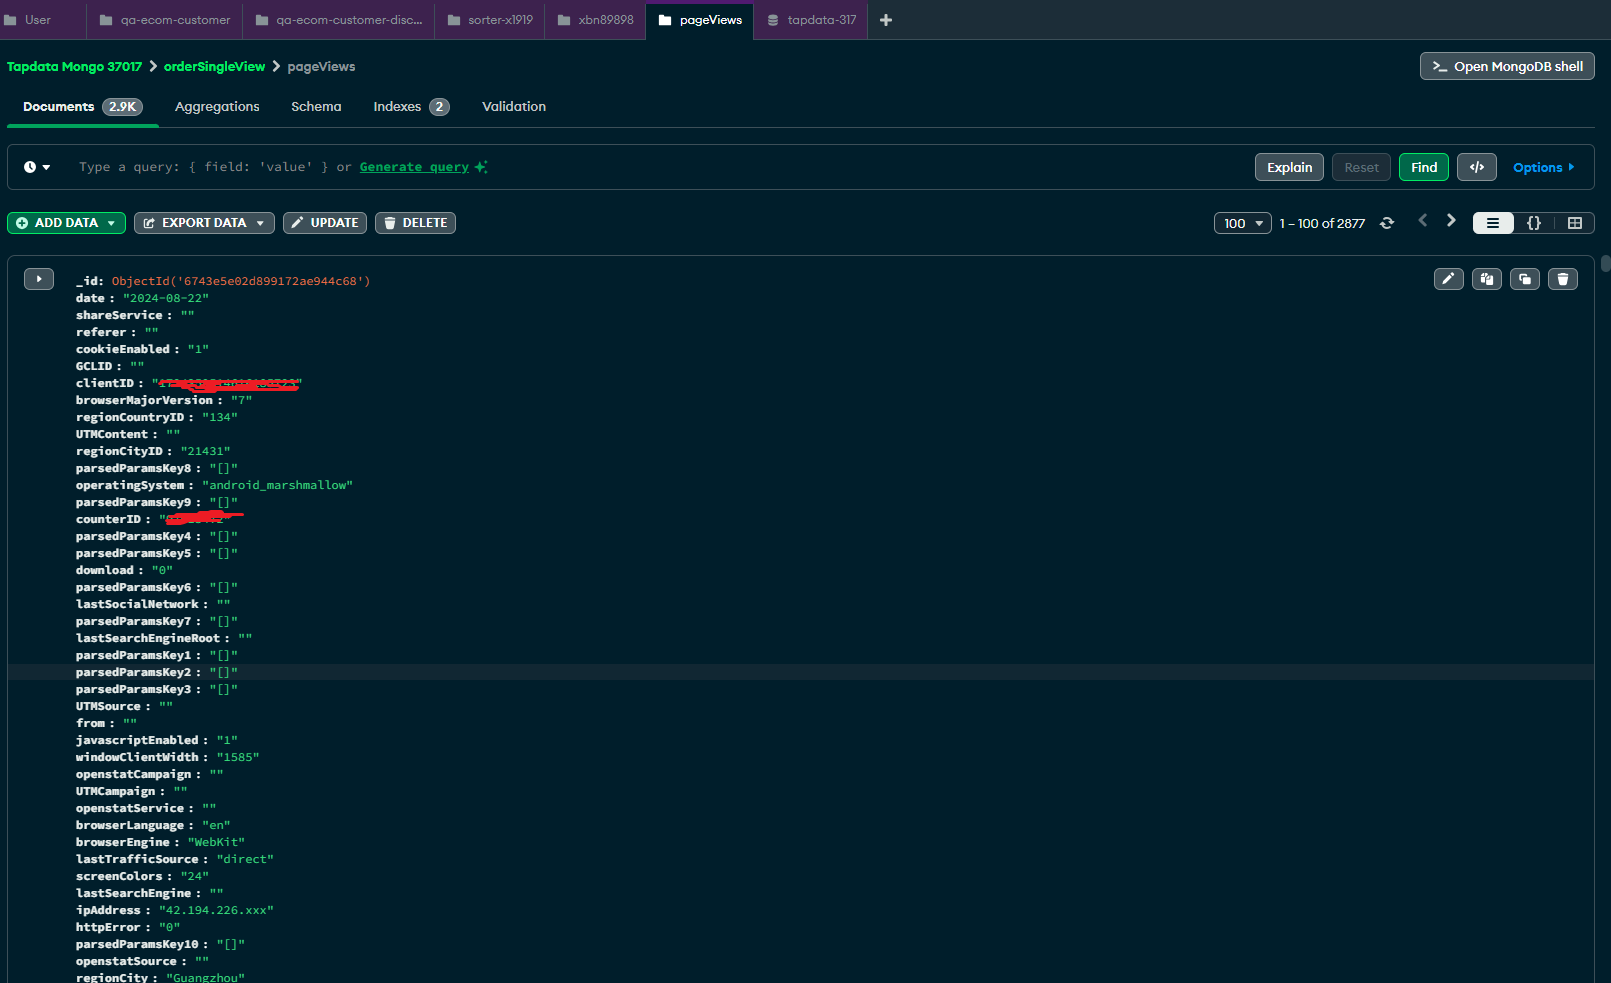
Conclusion:
Creating a counter in Yandex Metrica is a straightforward process that enables you to start collecting valuable analytics data for your website or app. By integrating this data into a data pipeline with Tapdata, you can automate the synchronization of Yandex Metrica metrics into MongoDB, providing you with a powerful tool for storing and analyzing web traffic data in real time.
With Yandex Metrica's in-depth analytics capabilities and Tapdata’s seamless integration, you'll be able to monitor your site’s performance and gain actionable insights to optimize user experience and marketing efforts.


